
Comments on the SA comparison of the operational performance of the largest municipalities
Haraldur L. Haraldsson, Mayor of Hafnarfjörður, and Kjartan Már Kjartansson, Mayor of Reykjanesbær, make comments on the SA comparison of the operating performance of the largest municipalities.
Haraldur L. Haraldsson, Mayor of Hafnarfjörður, and Kjartan Már Kjartansson, Mayor of Reykjanesbær, make comments on the SA comparison of the operating performance of the largest municipalities.
In their view, the Confederation of Industry's presentation of a comparison of the operational performance of municipalities and how they rank against each other based on different operational metrics does not give a true picture of the municipalities' current operational status. If the organisation's intention was to provide a picture of the average situation since 2002, this should have been made clearer. As it is presented, one might assume the summary refers to the current situation, which is not the case at all.
Comments on the Confederation of British Industry's comparison of the operating performance of the largest local authorities.
Serious reservations must be raised about the comparison that the Federation of Icelandic Businesses has made of the operating performance of the largest municipalities. We would particularly like to draw attention to the following, which does not give an accurate picture of the actual operations of municipalities today:
1) …and they are given points for their internal position in each individual comparison.
2) In today's discussion, we will compare the operational performance of the largest municipalities and how they measure up against each other based on different operational metrics.
3) Taxation and services are then also compared between municipalities. By its very nature, there is a strong correlation between the operation of local authorities and the services provided to residents. The better a local authority's core operations are run, the more scope it has to improve services for residents and reduce its tax collection.
Scoring
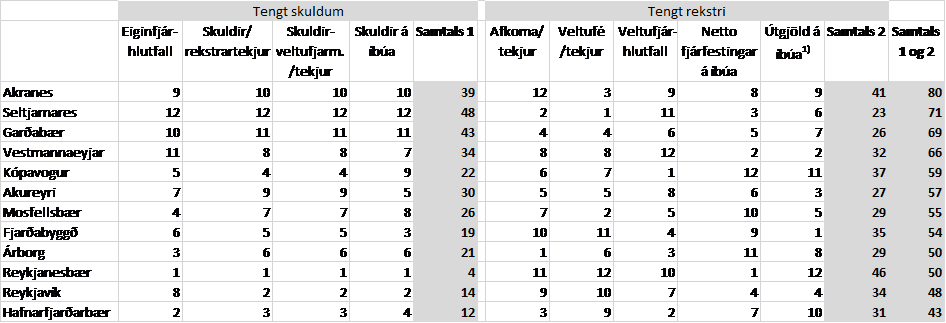
The scoring is noteworthy. The 12 municipalities are compared with one another and are given a score from one to 12 for each indicator. The council that performs best in each comparison receives 12. There does not need to be a large difference between councils to go from 12 to 1. Thus, the scoring can make a significant difference even when the gap between councils is small in individual metrics.
The operational performance of municipalities and how they compare with each other based on different operational metrics.
It is noteworthy that when operational performance is examined, four of the nine metrics are used that are directly related to debt. For obvious reasons, the municipalities with the lowest debt rank best in that comparison and consequently receive the highest scores. As the scoring system stands, this carries considerable weight, and the question is whether it is the right approach when assessing current operational performance for the debts of the past to carry so much weight?

As the table above shows, debt-related metrics are heavily weighted in this comparison. The municipality that scores highest on the debt-related measures, and therefore likely has the lowest debts, receives 48 points, i.e. the full score for these four measures, out of a total of 71 points. Other operational measures account for a total of 23 points.
By comparison, indebted municipalities, for obvious reasons, receive low scores on all four of these metrics. Reykjanesbær scores a total of 4 for debt-related metrics and 46 for operational metrics.
If the municipalities are ranked without the debt-related metrics, the order changes somewhat.

The municipality that comes out best in this comparison is Reykjanesbær. It is clear that municipal debts are an accumulated problem from previous years. Municipalities have generally not been taking out loans in recent years. They have been streamlining operations and paying down debt. Therefore, presenting a comparison in the way the Association of the Business Sector does gives a misleading picture of the current situation. It is noteworthy in the Organisation's summary that when comparing per capita expenditure, an average from 2002 to 2018 is used. That presumably refers to the average of the municipalities' annual accounts from 2002 to 2017 and the 2018 budget. There is a variable there that is not based on the same footing as the others. It is also clear that per capita spending at the start of this century tells us little about spending today. If it has been the intention of the Association to shed light on the financial management of the municipalities on average since 2002, then it would have been correct to make that clear, rather than as has been done here, which gives every reason to believe that the presentation does not give a true picture of the operating perfothe current financial position of the municipalities.
Good management seems to translate into lower tax collection per inhabitant overall.
„The result reveals that there is a strong correlation between how the municipalities rank in
the operational comparison above and the high proportion of residents“ income they take through taxation. This reveals the obvious truth that good management seems to result in lower taxation on residents overall."
Does this statement hold up perfectly and present a true picture? Firstly, a strong correlation is claimed with the operational comparison above, where four out of nine metrics are directly linked to debt, and to the proportion of residents' income that local authorities take in through taxation. Is it not necessary, when making such a statement, to delve deeper into the matter? Here, the tax base must surely matter greatly. It carries considerable weight when the rate of taxation is examined.

The table above shows the revenues of municipalities, less contributions to the equalisation fund in 2017, i.e. total levies in the municipalities, population as of 1 January 2017 and revenue per inhabitant.
As before, there are some shuffles in the rankings among the municipalities. Reykjanesbær has the lowest income per capita, and Hafnarfjarðarbær is in fourth place. I wonder if the tax assessment base has any effect here?
Number of residents per full-time equivalent

When examining the operations of municipalities, there are several metrics that need to be considered. One of these is the number of full-time equivalent positions, since payroll costs for municipalities typically amount to around 50 to 60 per cent of revenue. The table above shows the number of full-time equivalent positions in the aforementioned municipalities according to the 2017 Yearbook of Municipalities and the population figures as of January 2017. When the number of inhabitants per full-time equivalent is examined, Reykjanesbær and Hafnarfjarðarbær rank second and third, respectively, with the most inhabitants per full-time equivalent. Here, those municipalities would have scored highly.
Conclusion
From the above, it should be clear that the Confederation of British Industry's presentation of a comparison of the operational performance of local authorities, and how they rank against each other based on different operational metrics, does not provide a true picture of the current operational position of the local authorities. If the organisation's intention was to provide an overview of the average situation since 2002, this should have been made clearer. As it is presented, one might assume the summary refers to the current situation, which is not the case at all.
Haraldur L. Haraldsson, Mayor of Hafnarfjörður
Kjartan Már Kjartansson, Mayor of Reykjanesbær